Tidy Data
[2]:
> [...], a stack of elements is a common abstract data type used in computing. We would not think ‘to add’ two stacks as we would two integers.
>> Jeanette Wing - [Computational thinking and thinking about computing][computational thinking]


[computational thinking]: https://www.ncbi.nlm.nih.gov/pmc/articles/PMC2696102/
[…], a stack of elements is a common abstract data type used in computing. We would not think ‘to add’ two stacks as we would two integers. > Jeanette Wing - Computational thinking and thinking about computing
[3]:
A modernist style of notebook programming persists where documents are written as if programs are
starting for nothing. Meanwhile, authors of R programming language tend to begin with the assumption
that data exists and so does code. Notebook are a powerful substrate for working with data and
describing the logic behind different permutations.

pidgy was designed to weave projections of tabular into a computational documentation. Specifically,
we are concerned with the DataFrame, a popular tidy data abstraction that serves as a first
class data structure in scientific computing.
A modernist style of notebook programming persists where documents are written as if programs are starting for nothing. Meanwhile, authors of R programming language tend to begin with the assumption that data exists and so does code. Notebook are a powerful substrate for working with data and describing the logic behind different permutations.
pidgy was designed to weave projections of tabular into a computational documentation. Specifically, we are concerned with the DataFrame, a popular tidy data abstraction that serves as a first class data structure in scientific computing.
[4]:
import pandas as 🐼
import pandas as 🐼
[5]:
<hr/>
[6]:
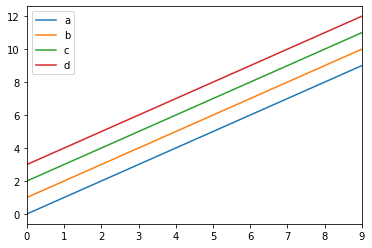
The figure above illustrates the information in `df`.

A high level numeric project of this data's statistics are:

{{df.describe().to_html()}}

The statistics were created using measurements that look like the following data:

{{df.head(2).to_html()}}

    df = 🐼.DataFrame([range(i, i+4) for i in range(10)], columns=list('abcd'))
    df.plot();
The figure above illustrates the information in df.
A high level numeric project of this data’s statistics are:
The statistics were created using measurements that look like the following data:
df = 🐼.DataFrame([range(i, i+4) for i in range(10)], columns=list('abcd'))
df.plot();
[7]:
<hr/>
[8]:
In technical writing we need to consider existing conventions like:
* Figures above captions
* Table below captions

It still remains to be seen where code canonically fits in reference to figures and tables.

[Why should a table caption be placed above the table?]

[Why should a table caption be placed above the table?]: https://tex.stackexchange.com/questions/3243/why-should-a-table-caption-be-placed-above-the-table
In technical writing we need to consider existing conventions like: * Figures above captions * Table below captions
It still remains to be seen where code canonically fits in reference to figures and tables.
[9]:
[notebook war]

[notebook war]: https://yihui.org/en/2018/09/notebook-war/